Quick Answer
CAPM prices a security's expected return from the risk-free rate plus beta times the market risk premium, since only systematic risk is priced. Beta measures that systematic risk, alpha measures the difference between a manager's actual return and CAPM's expected return (positive, zero, or negative), and the SML (beta) and CML (standard deviation, efficient portfolios only) plot those relationships.
This section works through the formula, its five assumptions, and the risk and performance measures (beta, alpha, standard deviation, R-squared) built on top of it, ending with how the SML and CML differ.
The Capital Asset Pricing Model (CAPM) determines expected returns based on systematic risk. The Series 65 exam tests CAPM, beta, alpha, standard deviation, R-squared, and the distinction between the Security Market Line and Capital Market Line.
What Is the CAPM Formula?
- Extends Modern Portfolio Theory by introducing the risk-free rate and the concept of a market portfolio
- Calculates the expected return of a security based on its systematic risk (beta)
- : Expected return of the security
- : Risk-free rate (typically 91-day T-bill yield)
- : Systematic risk relative to the market
- : Expected return of the market
- : Market risk premium (also called equity risk premium)
Formula Example
- Risk-free rate: 3%
- Market return: 10%
- Stock beta: 1.2
Calculation:
- Market risk premium = 10% - 3% = 7%
- Expected return = 3% + (1.2 x 7%) = 3% + 8.4% = 11.4%
Think of it this way: Start with the risk-free rate (what you'd earn with zero risk). Then add extra return based on how risky the investment is (beta x market risk premium). Higher beta = more extra return required.
Exam Tip: Gotchas
- CAPM only compensates investors for systematic (market) risk, not total risk. Unsystematic risk is assumed to be diversified away. If a question asks what return an investor should expect, use beta (systematic risk), NOT standard deviation (total risk).
What Are the CAPM Assumptions?
CAPM assumes:
- Investors are rational and risk-averse
- Markets are efficient (all investors have the same information)
- No transaction costs or taxes
- Investors can borrow and lend at the risk-free rate
- All investors have the same time horizon
What Does Beta Measure?
Beta measures a security's sensitivity to market movements: systematic (nondiversifiable) risk only.
- The market portfolio has a beta of 1.0 by definition
- Beta measures volatility relative to the market, not absolute volatility
| Beta | Meaning | Market moves +10%, stock moves... |
|---|---|---|
| > 1.0 | More volatile than the market (aggressive) | More than 10% |
| = 1.0 | Moves with the market (same volatility) | Exactly 10% |
| 0 < Beta < 1.0 | Less volatile than the market (defensive/conservative) | Less than 10% |
| = 0 | No correlation with the market (e.g., cash, T-bills) | 0% |
| Negative | Moves opposite to the market (rare; e.g., gold, inverse funds) | Negative direction |
- A stock with beta = 1.5 is expected to move 1.5x the market move (market up 10% -> stock up 15%)
- A stock with beta = 0.7 is expected to move 0.7x the market move (market down 10% -> stock down 7%)
- Portfolio beta = weighted average of individual asset betas
Exam Tip: Gotchas
- Beta measures systematic risk ONLY. A stock can have a low beta but high total risk (high standard deviation) if it has significant unsystematic risk. Beta does NOT capture company-specific risk. The exam tests whether you know that beta = systematic risk, standard deviation = total risk.
What Does Alpha Measure?
Alpha measures the excess return of a portfolio relative to its CAPM-expected return. It indicates whether a portfolio manager added or destroyed value after adjusting for risk.
| Alpha Value | Interpretation |
|---|---|
| Positive (+) | Manager outperformed on a risk-adjusted basis |
| Zero (0) | Manager performed exactly as CAPM predicted |
| Negative (-) | Manager underperformed on a risk-adjusted basis |
Alpha Example
- Portfolio returned 14%, Risk-free rate: 3%, Market return: 10%, Beta: 1.2
Step 1: Calculate CAPM expected return
- E(R) = 3% + 1.2 x (10% - 3%) = 3% + 8.4% = 11.4%
Step 2: Calculate Alpha
- Alpha = 14% - 11.4% = +2.6% (manager outperformed)
Think of it this way: Alpha answers the question "Did the manager beat what we expected given the risk they took?" A manager who earns 12% when CAPM predicted 10% has positive alpha, even if another manager earned 14%.
Exam Tip: Gotchas
- Alpha is NOT simply the difference between portfolio return and market return. If a portfolio returned 14% and the market returned 10%, the alpha is NOT 4%. You must first calculate the CAPM-expected return using the portfolio's beta, THEN subtract. The exam specifically tests this mistake.
What Does Standard Deviation Measure?
- Measures total risk (both systematic and unsystematic) of an investment
- Represents the dispersion of returns around the average (mean) return
- Higher standard deviation = wider range of possible outcomes = more risk
- Used in the Capital Market Line (total risk measure)
- Assumes returns follow a normal distribution (bell curve)
Normal Distribution and Standard Deviation:
| Range | Probability |
|---|---|
| Mean +/- 1 standard deviation | ~68% of returns |
| Mean +/- 2 standard deviations | ~95% of returns |
| Mean +/- 3 standard deviations | ~99.7% of returns |
- Example: Mean return = 10%, SD = 5%
- 68% chance returns fall between 5% and 15%
- 95% chance returns fall between 0% and 20%
Exam Tip: Gotchas
- Standard deviation measures TOTAL risk; beta measures only SYSTEMATIC risk. If a question asks about a well-diversified portfolio's risk, beta is the appropriate measure (unsystematic risk has been diversified away). If a question asks about a single stock's total risk, standard deviation is the appropriate measure.
What Does R-Squared Tell You?
- Measures how much of a portfolio's movement is explained by the benchmark index
- Ranges from 0 to 1.0 (or 0% to 100%)
- Indicates how reliable beta is as a risk measure for the portfolio
| R-Squared Value | Interpretation |
|---|---|
| 1.0 (100%) | Portfolio moves perfectly with the index; beta is fully reliable |
| 0.70+ (70%+) | Generally considered high; beta is a meaningful measure |
| Below 0.70 | Low; beta may not be a reliable risk measure; use standard deviation instead |
- An S&P 500 index fund has R-squared near 1.0 (tracks the index almost perfectly)
- A sector fund or single stock will typically have a lower R-squared
- R-squared is the square of the correlation coefficient (r): R-squared = r-squared
Exam Tip: Gotchas
- If R-squared is low, beta is unreliable. The exam tests whether you know to use standard deviation (total risk) instead of beta when R-squared is low, because the benchmark does not explain the portfolio's movements. A high R-squared validates the use of beta as a meaningful risk measure.
How Do the SML and CML Differ?
This is a frequent exam gotcha.
| Feature | SML | CML |
|---|---|---|
| Risk measure (x-axis) | Beta (systematic risk) | Standard deviation (total risk) |
| Applies to | Any individual security or portfolio | Efficient portfolios only |
| Y-intercept | Risk-free rate | Risk-free rate |
| Slope | Market risk premium (Rm - Rf) | Sharpe ratio of market portfolio: (Rm - Rf) / standard deviation of the market |
| Derived from | CAPM equation | Combining risk-free asset with market portfolio |
| Purpose | Shows required return for any given beta | Shows optimal risk-return tradeoff for portfolios |
How Does the Security Market Line Work?
The SML is the graphical representation of CAPM, plotting expected return against beta.
- X-axis: Beta (systematic risk)
- Y-axis: Expected return
- Y-intercept: Risk-free rate (where beta = 0)
- Slope: Market risk premium (Rm - Rf)
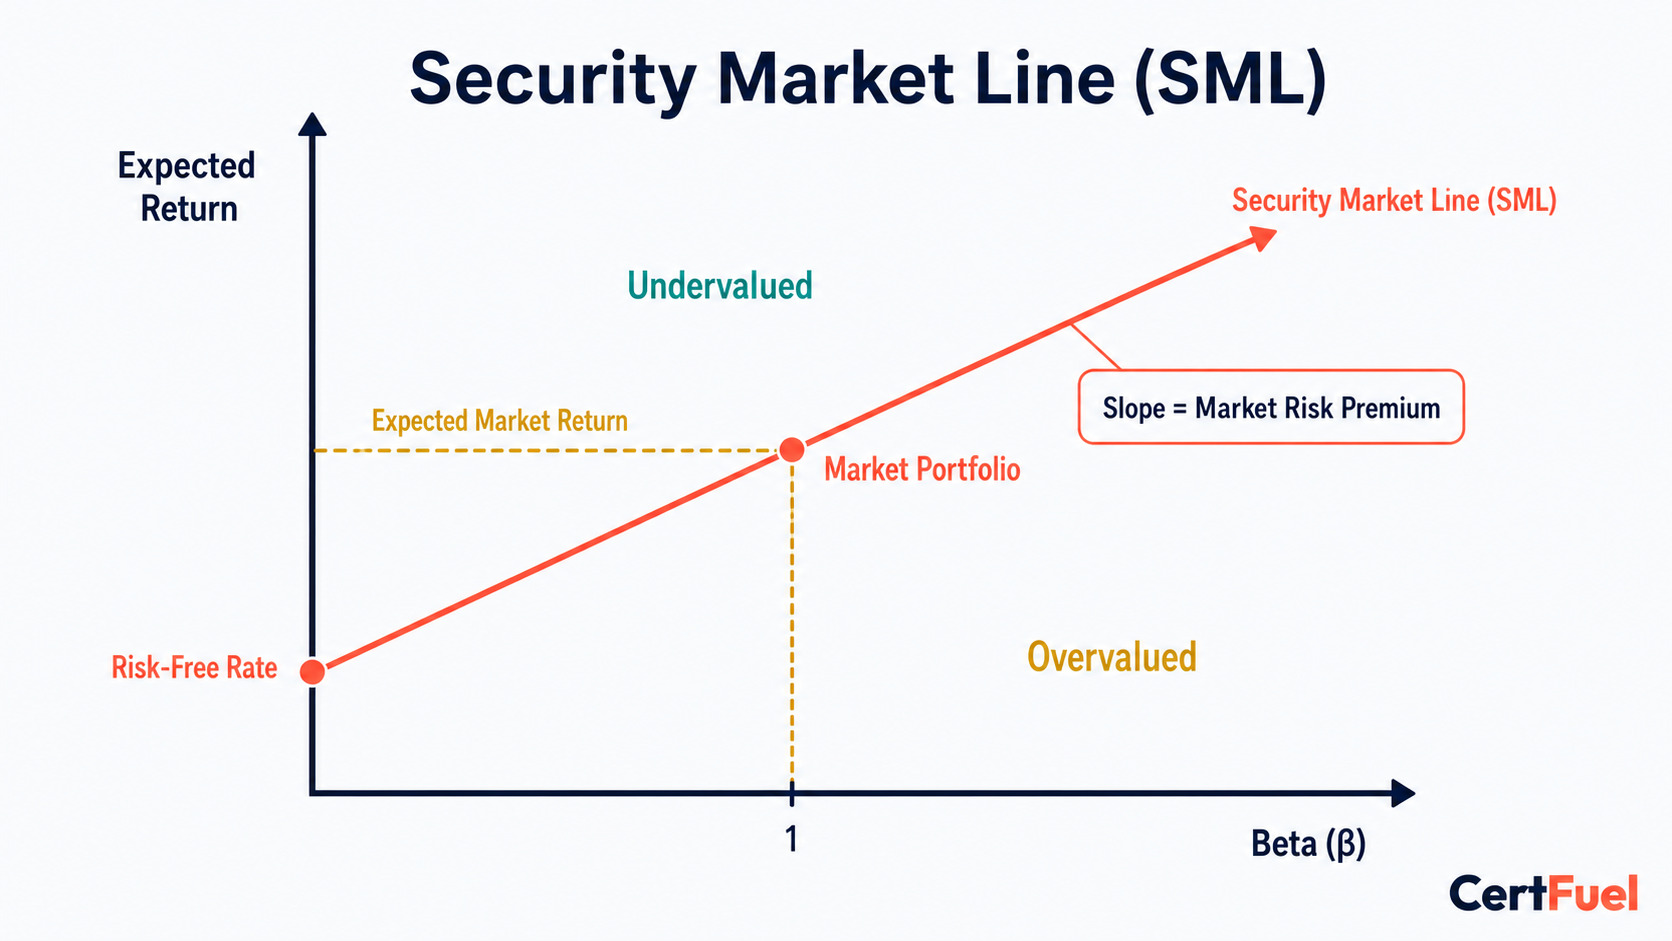
How Do You Use the SML to Value a Security?
- Above the SML = actual/forecasted return exceeds required return = undervalued = buy
- Below the SML = return is less than required for the beta = overvalued = sell
- On the SML = fairly valued
- Securities above the SML have positive alpha; securities below have negative alpha
Think of it this way: If a stock is above the SML, it's giving you more return than it should for its level of risk. That's a bargain. If it's below, you're not being compensated enough for the risk.
Exam Tip: Gotchas
- Above the SML = undervalued (good buy). Below the SML = overvalued (avoid or sell). "Above = overvalued" is a common wrong answer.
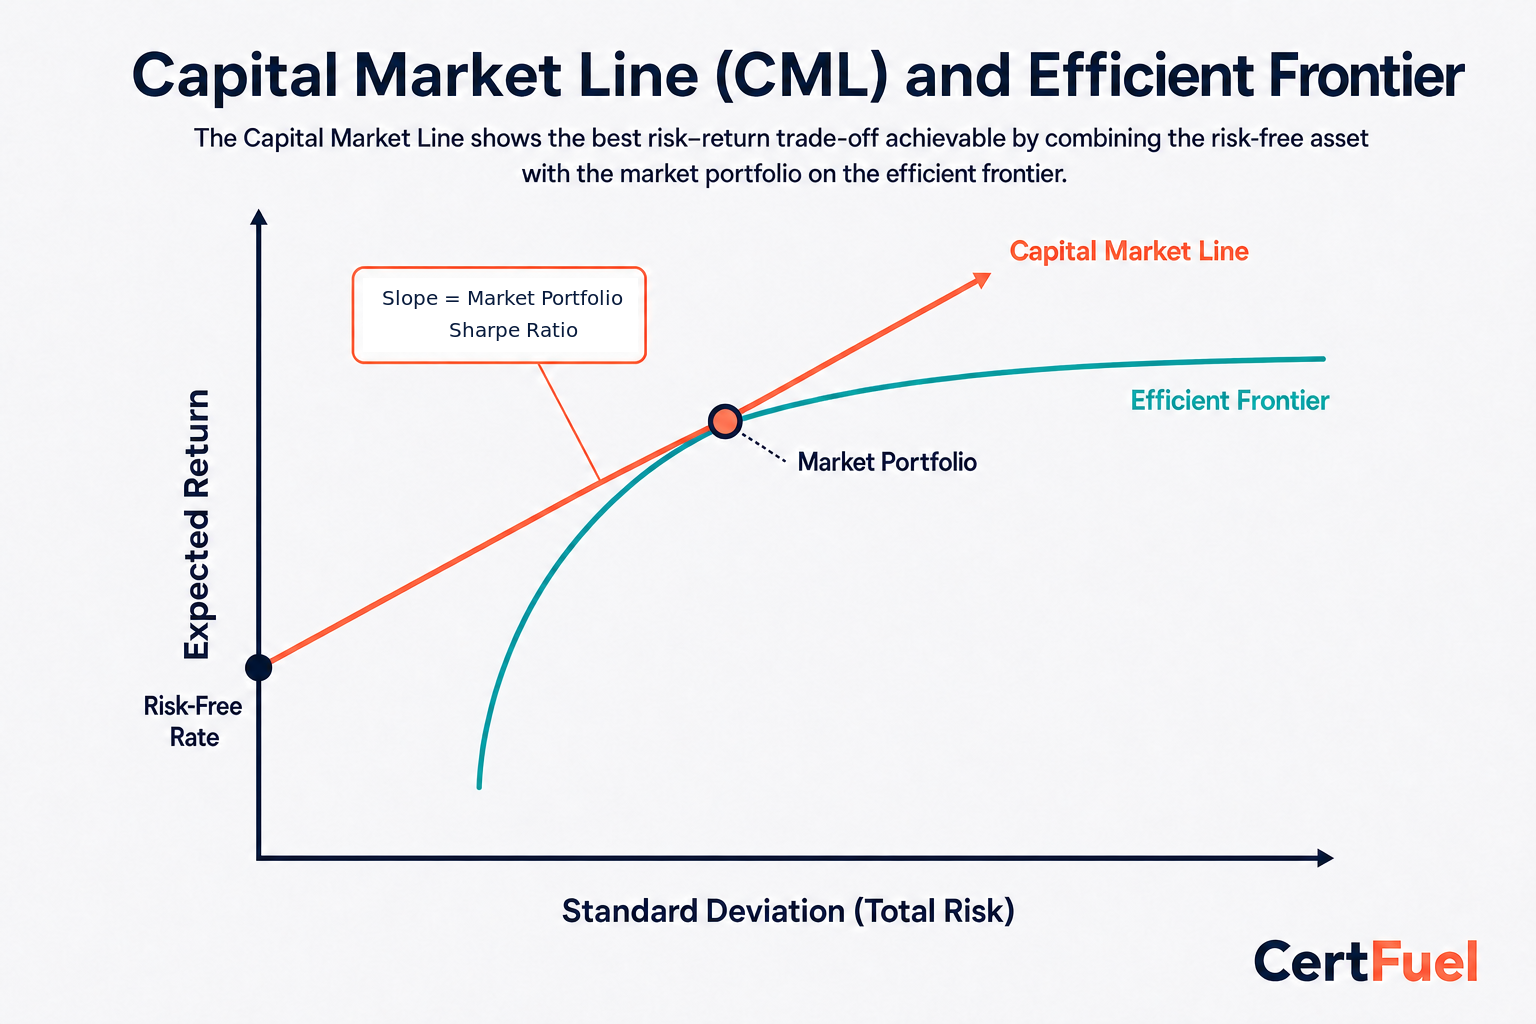
How Does the Capital Market Line Work?
- X-axis: Standard deviation (total risk), not beta
- Y-axis: Expected return
- Y-intercept: Risk-free rate (where standard deviation = 0)
- Slope: Sharpe ratio of the market portfolio: (Rm - Rf) / standard deviation of the market
- Applies only to efficient portfolios, not individual securities
- The CML is tangent to the efficient frontier at the market portfolio
- The CML is a single straight line running from the risk-free rate (zero standard deviation) up through the market portfolio and beyond. Every point on that line is some mix of the risk-free asset and the market portfolio
- Left of the market portfolio, on the CML (lower standard deviation than the market) = a lending portfolio: part of the money sits in the risk-free asset, part in the market portfolio, so both risk and expected return are below the market's
- Right of the market portfolio, on the CML (higher standard deviation than the market) = a borrowing portfolio: the investor borrows at the risk-free rate to hold more than 100% of the market portfolio (leverage), pushing both risk and expected return above the market's
- Only efficient portfolios (the risk-free asset combined with the market portfolio, in any weighting) lie on the CML
- Lending vs. borrowing describes where a portfolio sits along the CML (its standard deviation relative to the market portfolio). That's a different question from where a portfolio sits relative to the CML: a portfolio that plots below the CML is suboptimal for its risk level, whether it happens to be a lending or a borrowing mix
Why Does the CML Only Work for Efficient Portfolios?
- The CML's x-axis is standard deviation (total risk). That axis only produces a consistent, priced-risk relationship when there's no uncompensated risk hiding inside it.
- An efficient portfolio holds only the risk-free asset and the market portfolio. Combining those two eliminates unsystematic risk through diversification, so whatever standard deviation remains IS the portfolio's systematic risk. Total risk and priced risk are the same number, so standard deviation works as the risk measure.
- An individual security (or any undiversified portfolio) still carries unsystematic risk inside its standard deviation. CAPM assumes the market doesn't compensate investors for that risk, so a security's standard deviation mixes priced risk with unpriced risk. Two stocks with the same beta but different total risk should earn the same CAPM-required return, but they'd land at different points on a standard-deviation axis. Plotting them against standard deviation doesn't give a reliable return-for-risk line.
- The SML avoids this problem by using beta instead of standard deviation. Beta isolates systematic risk only, which is the risk CAPM says the market actually pays for, so it works for any security or portfolio, diversified or not.
Exam Tip: Gotchas
- CML uses standard deviation; SML uses beta. CML evaluates efficient portfolios; SML evaluates all assets including individual securities.
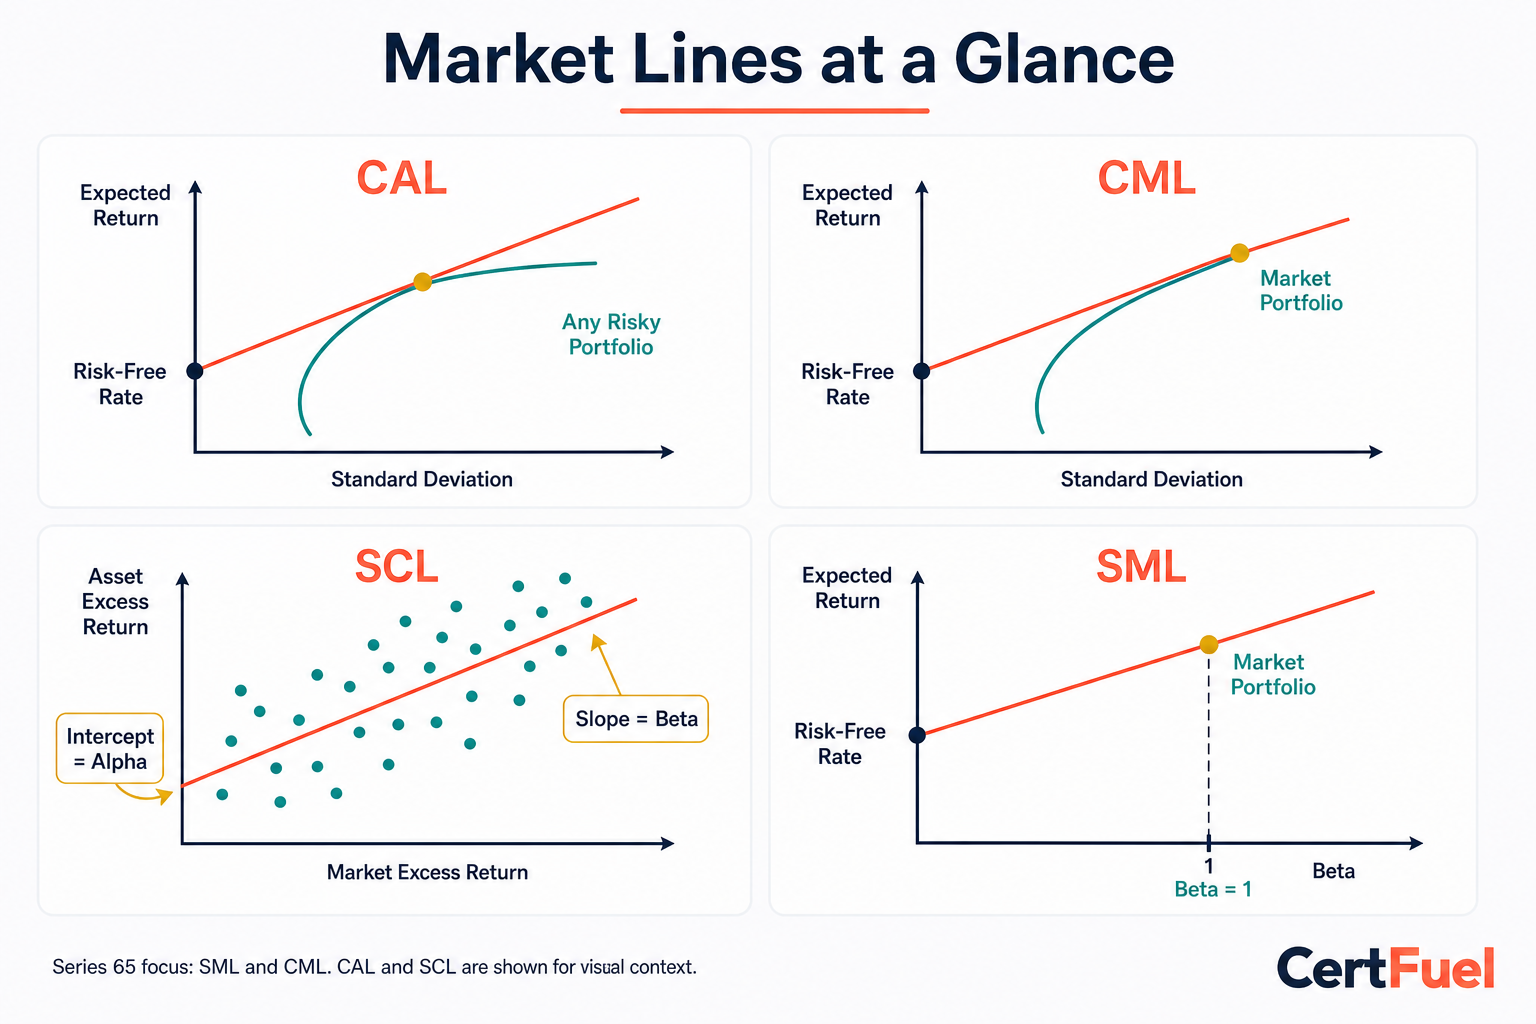
How Do CAL, CML, SCL, and SML Compare?
- The graph below places four related lines side by side. Series 65 tests the SML and the CML covered above.
- The Capital Allocation Line (CAL) and Security Characteristic Line (SCL) are shown for visual context only (they are not separately tested on this exam), so seeing all four together makes it easier to keep the SML and CML straight: notice the SML's x-axis is beta while the CML's and CAL's x-axis is standard deviation.
What Is the Sharpe Ratio?
- Covered in detail in the Portfolio Performance Measures unit, but referenced here because it connects to capital market theory
- Sharpe Ratio = (Portfolio Return - Risk-Free Rate) / Standard Deviation
- Measures return per unit of TOTAL risk (uses standard deviation)
- Higher Sharpe ratio = better risk-adjusted performance
- Related to the slope of the CML (the market portfolio's Sharpe ratio defines the CML slope)
What Are the Key Risk-Measure Relationships?
| Concept | Risk Measure Used | Applies To |
|---|---|---|
| CAPM / SML | Beta (systematic risk) | Any security or portfolio |
| CML | Standard deviation (total risk) | Efficient portfolios only |
| Alpha | Beta (via CAPM) | Manager performance evaluation |
| Sharpe Ratio | Standard deviation (total risk) | Any portfolio |
| R-Squared | N/A (validates beta reliability) | Portfolio vs. benchmark |
What Should You Check on Exam Day?
- Know the CAPM formula, E(R) = Rf + beta x (Rm - Rf), and be ready to compute it.
- CAPM only compensates for systematic risk (beta); standard deviation is total risk.
- Alpha requires calculating the CAPM-expected return first, then subtracting it from actual return. It is not simply actual return minus market return.
- The SML uses beta and applies to any security or portfolio; the CML uses standard deviation and applies only to efficient portfolios.
- Above the SML = undervalued (buy, positive alpha); below the SML = overvalued (sell, negative alpha).
- R-squared below 0.70 means beta is unreliable; use standard deviation instead.