Quick Answer
Diversification cuts unsystematic risk only, never systematic risk. Dollar-cost averaging buys more shares when prices fall, making average cost per share lower than or equal to average price per share. Protective puts limit losses while covered calls cap gains for income. Leverage amplifies both directions; daily-reset inverse funds are unsuitable for buy-and-hold investors due to compounding decay.
Portfolio management strategies set the overall allocation. Techniques are the specific tools advisers use to execute those strategies: reducing risk, generating income, amplifying returns, or hedging positions.
What Does Diversification Actually Reduce?
Diversification spreads investments across different asset classes, sectors, geographies, and securities to reduce risk. It reduces unsystematic (diversifiable) risk - the risk specific to an individual issuer. It does NOT eliminate systematic (market) risk - risk affecting the entire market. Note that NASAA's outline classifies sector risk as systematic, so spreading holdings across industries lowers concentration without eliminating sector risk itself.
How Does Correlation Drive Diversification Benefit?
Effectiveness depends on correlation between holdings:
- Correlation of +1.0 = move in perfect lockstep (no diversification benefit)
- Correlation of 0 = no relationship (moderate benefit)
- Correlation of -1.0 = move in opposite directions (maximum benefit)
What Should You Diversify Across?
- Asset classes to diversify across: domestic equity, international equity, fixed income, real estate, commodities, cash
- Over-diversification (diworsification) can occur when adding more securities no longer reduces risk but increases costs and complexity
Think of it this way: Diversification makes sure the eggs within each basket come from different farms. The less connected those farms are, the less likely they all fail at once.
Exam Tip: Gotchas
- Even a perfectly diversified portfolio does not eliminate systematic risk. A question asking "what risk remains after full diversification?" is asking about market/systematic risk.
- Maximum diversification benefit comes specifically from a correlation of -1.0 (perfect negative correlation); lower or negative correlation generally still helps, but only -1.0 is the maximum.
How Does Sector Rotation Work?
Sector rotation shifts portfolio allocation among economic sectors based on the business cycle. It is an active management technique that requires forecasting which sectors will outperform in each economic phase.
Which Sectors Lead in Each Business-Cycle Phase?
The distinction that carries the most weight is cyclical against defensive:
| Sector Type | Examples | When They Lead |
|---|---|---|
| Cyclical | Consumer discretionary, financials, industrials, technology, materials, energy | Expansion, when demand and business spending rise |
| Defensive | Utilities, healthcare, consumer staples | Contraction and recession, because demand for these holds up regardless |
Published models also split the expansion into early, mid, and late phases:
| Business Cycle Phase | Commonly Cited Sectors |
|---|---|
| Early expansion | Consumer discretionary, financials, industrials |
| Mid expansion | Technology, industrials |
| Late expansion | Energy, materials, healthcare |
| Contraction/recession | Utilities, healthcare, consumer staples |
- Treat the finer split as a convention, not a rule. Sector-cycle maps differ between published frameworks, and no sponsor document defines one. What is stable, and what the exam tests, is the cyclical-against-defensive direction
- Sector rotation requires successful market timing, which is difficult to execute consistently
Think of it this way: Picture the business cycle as a clock. Through the expansion, cyclical sectors lead, and leadership passes from the rate-sensitive names to technology and then to commodities as the expansion matures. At 3 (contraction/recession) utilities, healthcare, and consumer staples are the last sectors standing.
Exam Tip: Gotchas
- Rotate INTO defensive sectors (utilities, healthcare, consumer staples) during contraction/recession, and INTO cyclical sectors during expansion. Reversing these is a common trap, and it is the version of the question the exam is most likely to ask.
- Do not memorize one early-versus-mid mapping as though it were a rule. Frameworks disagree on exactly where technology sits inside an expansion. A question that turns on that boundary alone is testing a convention, not a defined standard.
How Does Dollar-Cost Averaging Work?
Dollar-cost averaging (DCA) invests a fixed dollar amount at regular intervals regardless of the current share price. The investor does NOT buy a fixed number of shares; the fixed element is the dollar amount.
How Does DCA Buy More Shares at Lower Prices?
- When prices are low, the fixed dollar amount buys more shares
- When prices are high, the fixed dollar amount buys fewer shares
- The result: the average cost per share is lower than or equal to the average price per share in a fluctuating market
Shares purchased each period = fixed investment ÷ price per share
What Does a DCA Example Look Like?
An investor commits $600 per month for four months:
| Month | Price/Share | Shares Purchased |
|---|---|---|
| 1 | $20 | 30.00 |
| 2 | $24 | 25.00 |
| 3 | $30 | 20.00 |
| 4 | $40 | 15.00 |
| Total | 90 shares |
- Total invested: $2,400
- Average price per share: ($20 + $24 + $30 + $40) / 4 = $28.50
- Average cost per share: $2,400 / 90 shares = $26.67
- The average cost ($26.67) is lower than the average price ($28.50) because DCA automatically buys more shares at lower prices
What Are DCA's Limitations?
- Does NOT guarantee a profit or protect against loss in a declining market
- Most effective in volatile, fluctuating markets
- Common implementation: automatic payroll deductions into 401(k) plans
- Lump-sum investing typically outperforms DCA over long periods (because markets trend upward), but DCA reduces timing risk
Exam Tip: Gotchas
- DCA uses a fixed dollar amount, NOT a fixed number of shares. If a question describes buying 100 shares every month, that is NOT dollar-cost averaging.
- Average cost per share is ALWAYS lower than or equal to average price per share in a fluctuating market. This is a math relationship, not a guarantee of profit.
How Are Options Used to Hedge a Position?
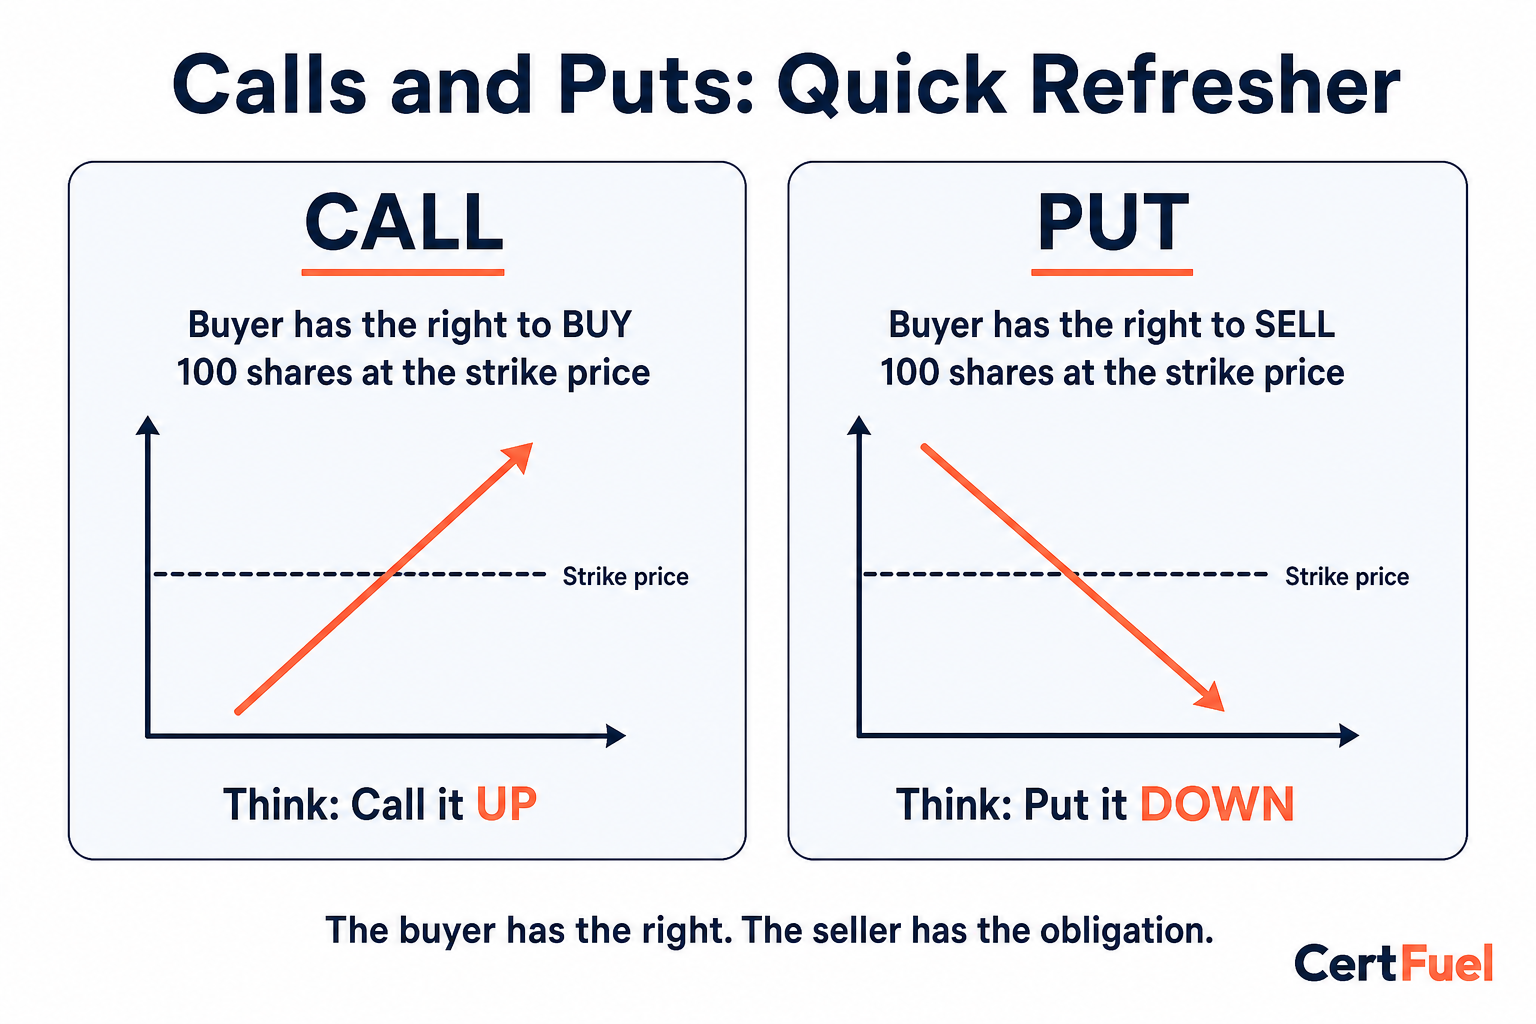
Options strategies are used for hedging (risk reduction), not speculation, in an advisory context. A quick refresher: a call is the right to buy a stock at the strike price, and a put is the right to sell a stock at the strike price. For the full breakdown of calls, puts, premiums, and strike prices, see Options and Warrants.
What Are the Core Options Strategies?
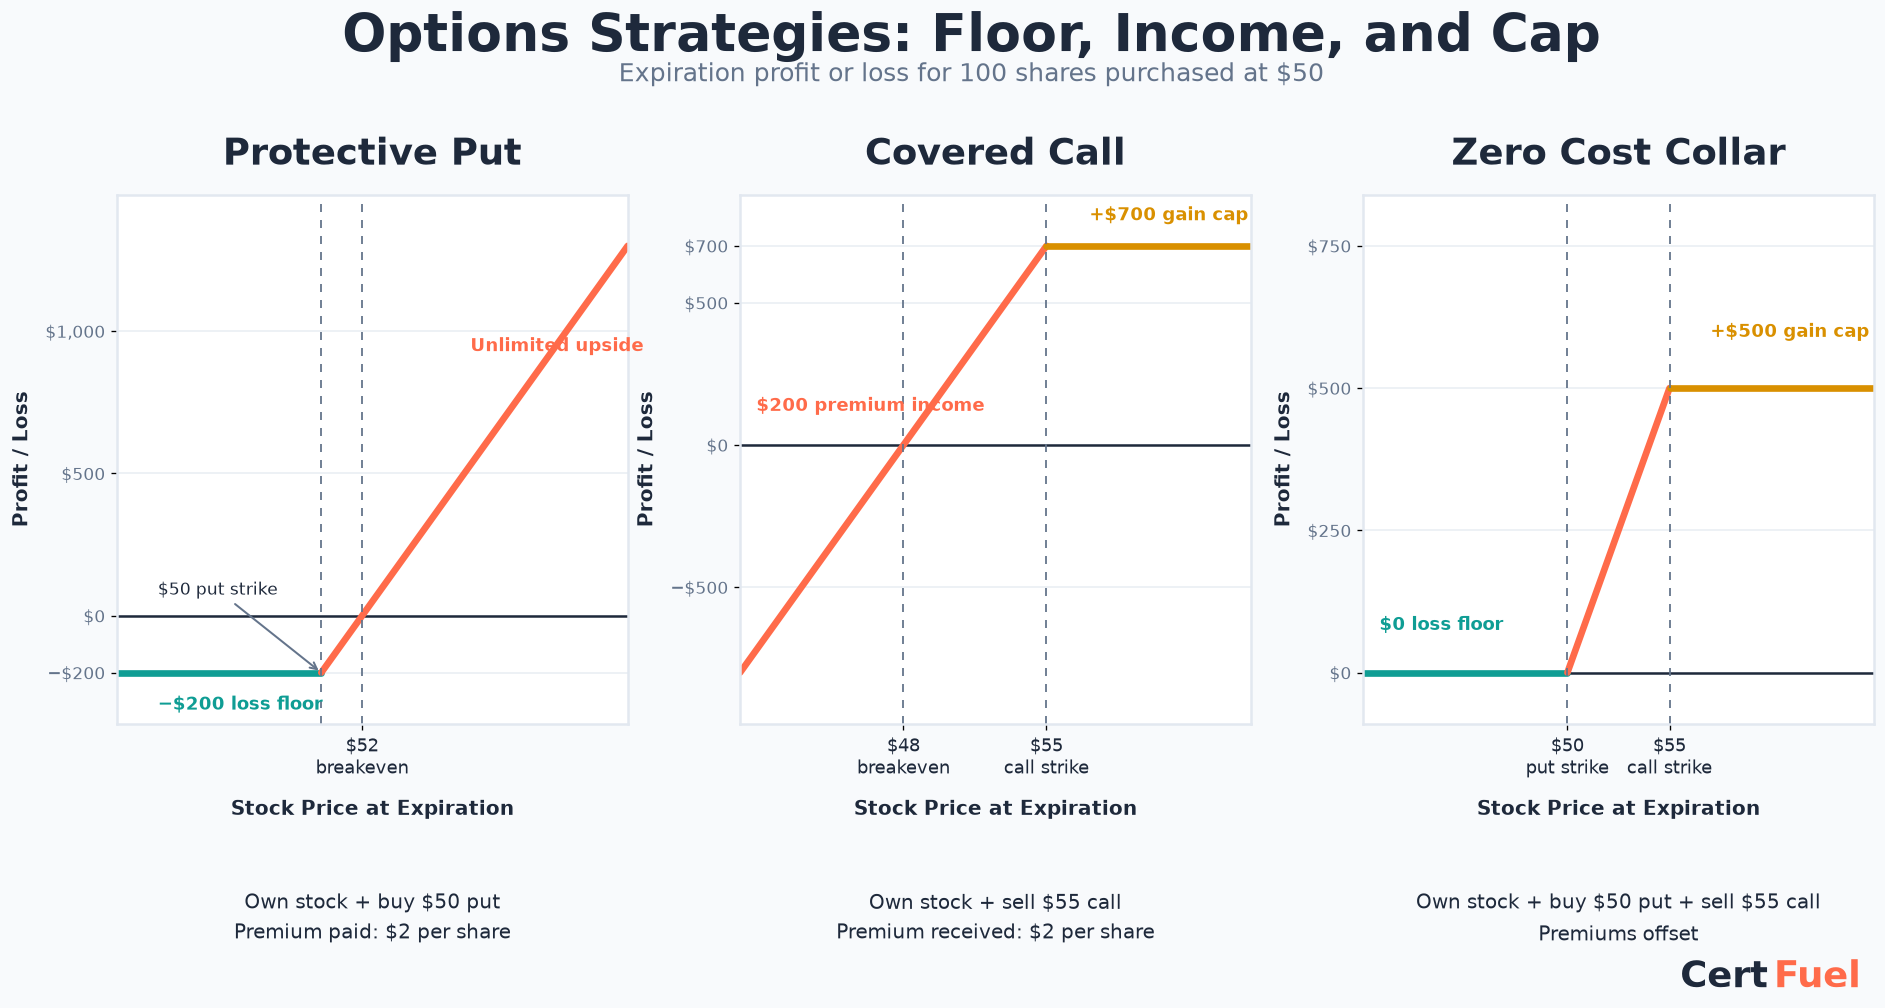
- Protective put - buying a put option on a stock you own to limit downside risk
- Acts as insurance - limits losses below the strike price minus premium paid
- Preserves unlimited upside potential (minus premium cost)
- Appropriate for investors who want downside protection but want to keep the stock
- Covered call - selling (writing) a call option on a stock you own
- Generates premium income that partially offsets potential losses
- Caps upside at the strike price (shares may be called away if price rises above strike)
- Appropriate for income-oriented investors or when expecting flat/modest price movement
- Collar - simultaneously buying a protective put and selling a covered call
- Put premium partially or fully offset by call premium received
- Creates a range of possible outcomes (limited downside and limited upside)
Think of it this way: Buying a protective put is like buying homeowner's insurance. You pay a premium for the right to be "made whole" if something bad happens. Selling a covered call is like renting out your spare room: extra income, but you give up some control.
How Do the Options Strategies Compare?
| Strategy | Position | Downside Protection | Upside Potential | Net Cost |
|---|---|---|---|---|
| Protective put | Own stock + buy put | Yes (limited to put strike) | Unlimited (minus premium paid) | Premium paid |
| Covered call | Own stock + sell call | No | Capped at call strike | Premium received |
| Collar | Own stock + buy put + sell call | Yes (limited to put strike) | Capped at call strike | Reduced or zero |
What Does the Payoff Look Like at Expiration?
An investor holds 100 shares bought at $50. Compare outcomes at expiration with no hedge, a protective put (strike $50, $2 premium), and a covered call (strike $55, $2 premium):
| Stock Price at Expiration | No Hedge (P/L) | Protective Put (P/L) | Covered Call (P/L) |
|---|---|---|---|
| $40 | -$1,000 | -$200 (floor) | -$800 |
| $50 | $0 | -$200 (premium cost) | $200 (premium kept) |
| $55 | +$500 | +$300 | +$700 (capped here) |
| $65 | +$1,500 | +$1,300 | +$700 (still capped) |
- The protective put's loss stops at -$200 no matter how far the stock falls: the put's floor plus the premium paid
- The covered call's gain stops at +$700 no matter how far the stock rises above $55: the call caps it there
- Neither hedge changes the breakeven math in the middle rows much; the difference shows up at the extremes, which is the entire point of hedging
How Do You Hedge a Short Stock Position?
Every strategy above assumes the investor owns the stock. A short seller holds the opposite exposure, so the hedge flips with it.
A short seller borrows shares and sells them, then must buy them back later. The loss grows as the price rises, and a price has no ceiling, so the loss is unlimited. That open-ended risk is what the hedge addresses.
- Buying a call (short stock + long call) limits the loss. The call gives the right to buy back the shares at the strike price, which caps what the repurchase can cost. This is the mirror image of the protective put.
- Max loss = (strike price - short sale price) + premium paid
- Max gain = short sale price - premium paid (the stock can only fall to $0)
- The downside profit is preserved, reduced only by the premium
- Selling a put (short stock + short put) generates premium income instead. It does not limit the loss. If the stock rises, the put expires worthless and the short position keeps losing without a ceiling.
Example: An investor sells short at $50 and buys a $55 call for $2.
| Stock Price | Short Alone (P/L) | Short + Long Call (P/L) |
|---|---|---|
| $30 | +$2,000 | +$1,800 |
| $50 | $0 | -$200 (premium cost) |
| $70 | -$2,000 | -$700 (capped here) |
| $100 | -$5,000 | -$700 (still capped) |
The unhedged loss keeps growing. The hedged loss stops at $700: the $500 gap between the $50 short price and the $55 strike, plus the $200 premium.
Think of it this way: A short seller owes shares, the way a borrower owes money. Buying a call locks in the worst price they will ever have to pay to settle that debt.
Exam Tip: Gotchas
- A protective put limits losses. A covered call generates income but caps gains. The exam may present a scenario asking which strategy protects against downside: the answer is the protective put, NOT the covered call.
- A collar does allow some upside, but only up to the short call's strike price: gains above that point are given up so the call premium can subsidize the put's cost. When a client's exact words are "keep my upside potential" (uncapped), the better match is a standalone protective put, not a collar. Reserve the collar for a client who is explicitly willing to cap gains in exchange for a cheaper (or zero-cost) hedge.
- The hedge follows the direction of the risk, not the direction of the position. A long stock position loses when the price falls, so it is hedged with a put. A short stock position loses when the price rises, so it is hedged with a call. Buying a put against a short position is the classic trap answer: it adds more bearish exposure instead of offsetting the risk.
- Income is not protection. Selling a put against a short position collects premium, and selling a call against a long position collects premium, but neither one caps the loss. Only the purchased option sets a floor or a ceiling.
How Does Leveraging Amplify Risk?
Leverage uses borrowed funds (margin) to increase the size of an investment position. It amplifies both gains AND losses - a double-edged sword.
How Does a Margin Account Work?
- Margin account required; investor borrows from the broker-dealer using securities as collateral
- Margin call occurs when equity falls below the maintenance requirement; investor must deposit additional funds or securities
- The broker-dealer charges margin interest on the borrowed funds, and this interest accrues regardless of how the portfolio performs. It reduces the investor's net gain in a rising market and adds to the net loss in a falling market, which is part of why leverage's gains and losses are not symmetric.
- The margin thresholds themselves (Regulation T initial margin, the FINRA maintenance minimum, the minimum equity requirement, and buying power) are covered in the Trading Securities unit. This section treats leveraging as a portfolio technique rather than as margin account mechanics.
Who Is Leverage Suitable For?
- Higher risk than unleveraged investing; potential to lose more than the original investment
- Not suitable for all investors - only appropriate for those with high risk tolerance and sufficient financial resources
Exam Tip: Gotchas
- Leverage amplifies both directions. A question about a leveraged portfolio losing value is testing whether you understand that the investor loses a larger percentage of equity than the portfolio's percentage decline.
How Do Advisers Manage Portfolio Volatility?
Volatility management techniques aim to control portfolio risk by reducing exposure during high-volatility periods.
What Measures Volatility?
| Measure | What It Measures |
|---|---|
| Standard deviation | Portfolio volatility (higher standard deviation = more volatile) |
| Beta | A security's volatility relative to the market (beta > 1 = more volatile than market) |
What Methods Reduce Volatility?
- Asset allocation shifts - moving to more conservative assets (bonds, cash) when volatility spikes
- Options hedging - buying protective puts or collars during volatile markets
- Volatility targeting - adjusting exposure to maintain a constant level of portfolio volatility
- Stop-loss orders - automatic sell orders triggered when a security falls to a specified price
Advisers have a fiduciary duty to ensure portfolio volatility matches the client's risk tolerance.
Exam Tip: Gotchas
- "Volatile markets" and a "range of outcomes" describe two different things here. The collar itself creates a range for the investor's P/L (limited downside, limited upside): it is not a bet that the market will trade sideways. Options hedging (protective puts and collars) is one of several methods advisers use to manage volatility during volatile markets.
Think of it this way: Volatility is how bumpy the ride is. Two portfolios can both average 8% returns over 10 years, but the one with wild swings (up 30%, down 20%) feels very different from the one that steadily gains 7-9% each year. Managing volatility means smoothing the ride to match the client's comfort level.
How Do Inverse and Leveraged Funds Work?
Inverse funds (inverse ETFs) seek to deliver the opposite of the daily performance of a benchmark index. If the S&P 500 falls 1%, a 1x inverse S&P 500 ETF aims to rise ~1% (before fees). For the full breakdown of leveraged and inverse mechanics, see Leveraged Funds and Inverse Funds.
How Do Leveraged Inverse Funds Amplify Returns?
- Leveraged inverse funds amplify the inverse return (e.g., 2x or 3x the opposite daily return)
- Daily reset mechanism; returns are calculated and reset each trading day
- Compounding decay (volatility drag) causes returns over longer periods to deviate significantly from the expected inverse multiple
How Does the Daily Reset Actually Work?
- Returns are calculated and reset each trading day, so each day's target resets from a new starting point (the prior day's closing value), not from your original purchase price
- That reset is what allows losses (or gains) to compound on themselves across multiple days, which can cause compounding decay over multi-day holding periods
Worked example: a 2x leveraged fund tracking an index that swings up 10% then back down, ending flat overall.
| Day | Index Return | Index Value | 2x Fund Return | 2x Fund Value |
|---|---|---|---|---|
| Start | n/a | 100 | n/a | 100 |
| Day 1 | +10% | 110 | +20% | 120 |
| Day 2 | -9.09% | 100 | -18.18% | 98.18 |
| Result | 0% (flat) | 100 | n/a | 98.18 (loss of 1.82%) |
- The index ends exactly where it started, but the fund lost 1.82%
- Day 2's -18.18% is calculated off Day 1's already-inflated value of 120, not off the original 100, so the loss on the way down eats into a bigger base than the gain on the way up
- The same math applies to inverse funds: an inverse fund can lose money over several days even when the index also declines, because each day's percentage move compounds off the prior day's reset value rather than netting out cleanly over the holding period
Who Are Inverse Funds Suitable For?
- NOT suitable for buy-and-hold investors - designed for short-term trading or hedging
- FINRA has warned that leveraged/inverse ETFs are generally unsuitable for retail investors holding beyond one trading session
Exam Tip: Gotchas
- The exam tests that leveraged and inverse ETFs reset daily. Over multiple days, compounding can cause significant deviation from the expected return. In a volatile, flat market, both leveraged and inverse ETFs can lose value even if the underlying index is unchanged. These products are unsuitable for long-term holding.
What Is High-Frequency Trading?
High-frequency trading (HFT) uses powerful computers and algorithms to execute a large number of trades at extremely high speeds (microseconds to milliseconds).
What Are HFT's Key Characteristics?
- Strategies include market making, arbitrage, and momentum trading
- HFT firms profit from very small price differences across markets or tiny bid-ask spreads
- Not a strategy available to retail investors - requires significant technology infrastructure and co-location at exchanges
What Impact Does HFT Have on Markets?
- Advantages: Increases market liquidity, narrows bid-ask spreads
- Criticisms: Creates unfair advantages, may increase market volatility, "flash crashes"
- Regulatory scrutiny from SEC and FINRA regarding market fairness and stability
Exam Tip: Gotchas
- HFT is NOT available to retail investors. If a question asks what strategy is available only to institutional or proprietary traders, HFT is the answer.
- HFT can both help (tighter spreads) and hurt (flash crashes) markets. The exam tests both sides.
What Should You Check on Exam Day?
- Diversification reduces unsystematic (diversifiable) risk only; it never eliminates systematic (market) risk.
- Maximum diversification benefit comes specifically from a correlation of -1.0; correlation of +1.0 gives no benefit.
- Sector rotation moves into cyclical sectors during expansion and defensive sectors (utilities, healthcare, consumer staples) during contraction. The finer early, mid, and late split is a convention that differs between published frameworks, so do not memorize one mapping as a rule.
- DCA invests a fixed dollar amount, not a fixed number of shares; average cost per share is always lower than or equal to average price per share in a fluctuating market, but that is a math relationship, not a guaranteed profit.
- A protective put limits downside while keeping upside; a covered call generates premium income but caps upside; a collar combines both for a capped range at reduced or zero net cost.
- A short stock position loses when the price rises, so it is hedged by buying a call, not by buying a put; max loss is the strike minus the short sale price, plus the premium. Selling a put against a short position only collects income and caps nothing.
- Leverage amplifies both gains and losses; a margin call follows when equity falls below the maintenance requirement, and margin is not suitable for all investors.
- Leveraged and inverse ETFs reset daily, so compounding can cause returns to deviate significantly from the expected multiple over multiple days; they are unsuitable for buy-and-hold investors.
- High-frequency trading is institutional infrastructure not available to retail investors, and it can both narrow bid-ask spreads and contribute to flash crashes.